Donacion

martes, 13 de diciembre de 2016

Cambio de tendencia Ethereum Classic

Anteriormente se realizo una posición larga (compra en el par ETC/BTC) ya que entramos luego a dicha posición debido al indicador ichimoku ya que mostro un patrón donde consiste en que el precio debía romper la nube junto con el tenkan-sen y kijun-sen ya que se considero como una pequeña señal de entrada, pero la señal de entrada se reafirmo justo cuando una vela alcista abrió por debajo del tenkan-sen y cerro por encima del mismo, ademas de haber realizado el cierre sin tocar la nube y después de 7 velas por encima. A esto ademas le agregamos los valores que mostraba el indicador ADX, específicamente el DMI+ donde su valor después del cierre fu de 29.1619.
Otro análisis que se aplico en dicho par fue en base a figuras chartistas, específicamente la cuña alcista, el cual consistió en que el precio rompió la cuña y ademas hubo rechazo en el precio para volver a incorporarse en la tendencia bajista. ( Análisis chartista realizado por: Javier Sanchez)


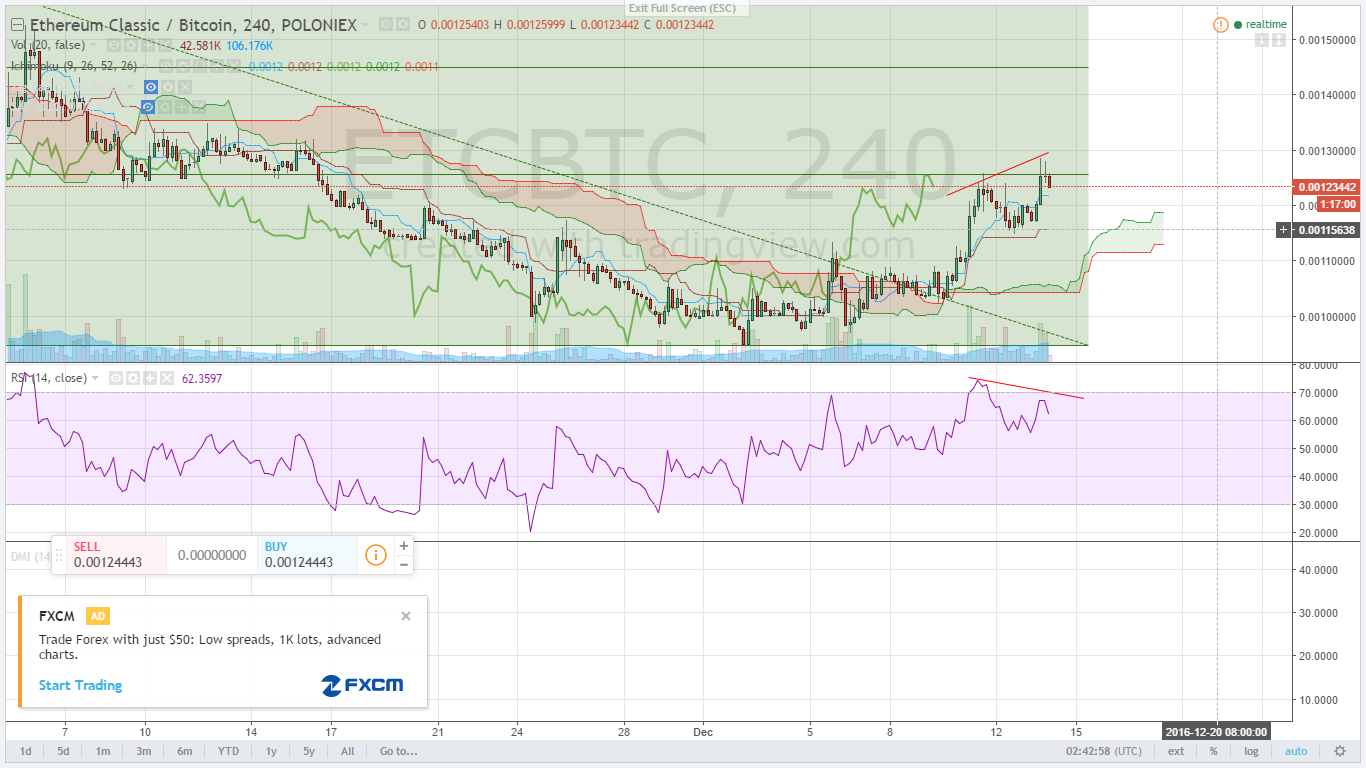
Actualmente el precio de Ethereum Classic esta tocando el nivel de Fibonacci en 0.236 o el precio de 0.00125513 a esto vemos como anteriormente llego a ese nivel y realizo una corrección para luego volver a ese nivel y se puede apreciar como esta volviendo a bajar, en conjunto el indicador RSI muestra una clara divergencia donde los movimientos de este indicador no coinciden con los movimientos que realiza el precio, por el momento podremos vender  nuestros ETC para encontrar otra oportunidad de compra.

jueves, 8 de diciembre de 2016

LTC... otra vez

En la entrada anterior se había escrito acerca de la posible caída de Litecoin... del cual fue así, pero ahora es algo notoria la posibilidad de que tenga un cambio de tendencia donde es probable que llegue a los 4 USD nuevamente, esto en base al indicador ichimoku donde vemos lo poco ancha que es la nube la cual seria fácil de romper en caso de que siga el precio en rango, pero en caso dado donde el panorama muestre de que el precio rompa lo delgado que está la nube seria uideal colocar una orden de compra limite en los niveles de 3.60 USD aproximadamente.Ademas el indicador ADX junto con el DMI- vemos como esta regresando a los niveles 20 del mismo indicador, donde nos señala que la caída que ocurrió no fue  de mayor preocupación. En caso de que el precio llegue a la orden de compra y esperar a que suba el precio saldríamos con beneficios a los niveles de los 4.05 USD.

domingo, 4 de diciembre de 2016

FCT/BTC

El siguiente par que tenemos es el FCT/BTC del cual podemos ver que con días anteriores y horas anteriores ha tenido una tendencia totalmente bajista donde viene seguido por impulsos y retrocesos continuando así con su tendencia a la baja pero a su vez parece que esta misma se esta debilitando, en temporalidad de 4 horas los impulsos y retrocesos ya mencionados con anterioridad (ondas) de las cuales esta por formarse el quinto impulso para luego después esperar a que el precio entre lateral o en rangos y esperar que haga algún patrón, ya sea el hombro-cabeza-hombro invertido y esperar su posible cambio de tendencia, esto ademas viene acompañado con el indicador ADX en conjunto con sus DMI donde vemos en movimientos anteriores el DMI- y el ADX van acompañados a los niveles 50 y 40 donde muestra que claramente se va debilitando poco a poco la tendencia bajista, si apreciamos actualmente el DMI-  y el ADX se encuentran por debajo del valor de 20 del cual nos indica que su tendencia bajista está debilitada. Por mientras situaremos nuestro precio de entrada para entrar largos en dicho par al precio de 0.00231563 y salir con beneficios en 0.00294956.


martes, 22 de noviembre de 2016

LTC/ BTC

Tenemos los pares de LTC/BTC en temporalidad de 4 horas, donde podemos ver el precio con anterioridad estuvo lateral donde tuvo cierto impulso ligero al alza pero al encontrarse con la resistencia de la nube del ichimoku no pudo superar esos niveles donde ademas coincide con un nivel de FIbonacci en 0.382 o 38.2 y vemos como se devuelve a los niveles anteriores donde se encontraba lateral, ademas el indicador ichimoku muestra que el precio esta por debajo de la nube en conjunto con el tenkan-sen, kijun-sen y chikouspan del cual aumenta las posibilidades de continuar bajando el precio, ademas podemos apreciar como el tenkan y el kijun estan por cruzarse, ademas los osciladores en especifico el estocastico esta dentro del area de sobre venta podemos esperar un falso cruce donde el precio se encuentre en el siguiente nivel de Fibonacci que es el 50.0 o 0.5 mismo que este nivel coincide con a resistencia que forma la nube donde en esos niveles colocaríamos una orden de venta (0.00535858 aprox.) en caso de que entre la orden de venta, nuestro objetivo para salir con beneficios seria el 61.8 o 0.618, en caso contrario donde el precio vaya en nuestra contra saldríamos con perdidas en el nivel 0.382 o 38.2 


jueves, 8 de septiembre de 2016

XRP

Tenemos en la mira el par XRP/BTC del cual vemos en el gráfico de 4 horas una clara tendencia bajista, pero nos hemos percatado en la divergencia que existe entre el oscilador RSI junto con el precio, de igual manera analizamos en temporalidades mas pequeñas y encontramos la misma divergencia, del cual existe la probabilidad que el precio de ese par empiece a subir considerablemente pero para después continuar a la baja. Si aplicamos la teoría de las ondas de Elliot en conjunto con fibonacci podemos considerar que el primer impulso a la baja pueda hacer un retroceso pero nunca superar el primer impulso, así que consideramos que su retroceso llegue a 0.5 y 0.618 donde en esos niveles pueda ser un impulso hacia abajo con mas fuerza. Tomaría un poco de tiempo puesto que la temporalidad es mucho mayor.

miércoles, 7 de septiembre de 2016

Factom y Monero, un sabor agridulce

En los mercados, en especial las criptodivisas encontramos mucha volatilidad que esto mismo nos conlleva a mayor riesgo, tal es la siguiente triste historia, de la cual hemos abierto operaciones en los activos Factom y Monero. En el primer activo que es Factom entramos en una posición de venta (cortos) en el precio de 0.00448337 de satoshis del cual en este momento que estamos escribiendo el precio de factom aumento su valor a 0.00486119 por lo tanto llevamos una perdida de -0.01072 satoshis aproximadamente, la razón por la cual entramos cortos en Factom fue por considerar que puede existir un rebote o un retroceso au hacia abajo al tocar los niveles de fibonacci 0.236 del cual se paso a los siguientes niveles pero aun no consideramos que sea un cambio de tendencia hasta romper la nube del hichimoku y se de la confirmación.
En cuanto a Monero, decidimos entrar en una posición de compra en los niveles 0.01927919 satoshis ya que estaba próximo a tocar el nivel de fibonacci y asumimos que daría la vuelta (del cual si lo hizo) y dicho y hecho reboto al nivel de aproximadamente en el precio de 0.01881230 del cual actualmente se encuentra en el precio de 0.01990100 con una ganancia aproximada de 0.0179. Aun mantendremos las posiciones abiertas especialmente la de Monero.

Reglas de oro para tener exito en cualquier mercado

Especular en los mercados no es una cosa sencilla puesto que puede pasar cualquier cosa, siempre habrá alguno que otro que sea alcista o bajista, en ocasiones estable. Pero en este caso nos enfocamos particularmente en las criptodivisas, recordemos que son activos descentralizados y se rigen puramente por ley de oferta y demanda, claro, también consideramos noticias que suelen ser de alto impacto en el precio de alguna criptodivisas en especifico, recordemos el caso de Bittrex el cual esta casa de cambio sufrió un robo de fondos afectando a los usuarios. No nos desviemos tanto del tema principal el cual como el titulo lo dice: reglas de oro para obtener éxito en cualquier mercado de las cuales las enumeramos de la siguiente manera:

1.- Crear un plan de juego: Esta regla es considerada como la piedra angular del éxito de un trader. Crear su simple plan de juego que indique el porque vas a comprar o vender algún activo en el mercado. Hacer esto construye confianza en el camino de un operador.

2.- Determinar la tendencia del mercado: Esta es la regla mas importante y la mas fácil. Las utilidades grandes se hacen en dirección de la tendencia principal. Siempre hay que tener en mente esto.

3.- Diversificar: Esto nos lleva a disminuir el riesgo, cuando se diversifica en 4 o 6 mercados sin correlación se reduce el riesgo y puede llevarnos a mejor rentabilidad.

4.- Siempre pero siempre usar un stop loss (salir con perdidas): En los mercados hay que tener alta tolerancia a la frustración puesto que en ciertas ocaciones no siempre el mercado realizara los movimientos que según a criterio de cada individuo pueda hacer, siempre hay que considerar los riesgos que puedan existir pero sin dejar a un lado los beneficios que puedes obtener, esto también abarca cuestiones psicológicas el cual puedes ir adquiriendo conforme operes en el mercado.

5.- Sobre todas las reglas anteriormente mencionadas, DISCIPLINA: Esto es la parte mas complicada de dominar, es algo fácil de decir pero en realidad es muy difícil de poner en practica, abarca otros factores como la persistencia, consistencia y nunca darse por vencido, quizá sea muy difícil durante el recorrido y conforme adquieras conocimiento en este tipo de negocios, pero siempre hay que mantenerse firmes en el trading y obtendrás éxito.

6.- La clave: la ultima clave es tu mente (quizá suene absurdo puesto que nadie se hace millonario con el poder de la mente, obvio no) pero a lo que voy es que debes de conocerte a ti mismo de acuerdo a tu personalidad para adaptarse en los mercado y obtener el éxito deseado en pocas palabras cree en tu juicio, cree en tu estrategia, cree en tu éxito.

martes, 6 de septiembre de 2016

Ganancias!

Como analizamos en el post anterior el precio de XMR y la posibilidad de continuar al alza fue todo un exito donde nuestro precio de entrada fue en 0.02055000 y salimos en cuanto el precio llego a 0.02324015 con respectivas ganancias.
Aun existen las probabilidades que XMR continue subiendo en cuanto a su precio, ya que claramente vemos su tendencia al alza y tocar su nivel maximo para luego detenerse y darse la vuelta, esto lo justificamos en base a la teoria de las ondas de Elliot, de las cuales consiste según su autor, los mercados suben en avances de cinco ondas y continúan con correcciones de descanso de tres ondas. Los movimientos alcistas 1, 3 y 5 son denominadas, según Elliot, ondas de impulso. Los movimientos bajistas 2 y 4 son denominados ondas correctivas. Donde su interpretacion en conjunto con los niveles de Fibonacci es que la onda 2 nunca puede regresar hasta el inicio de la onda 1 como podemos observar el precio regresa hasta el nivel 0.618 para luego tomar impulso y formar la 3ra onda para despues la 4ta onda de la cual no regresa hasta el inicio de la primera onda y como comentamos con anterioridad existe la probabilidad que se de un 5to impulso obviamente al alza.
Nota: Operar con activos puede llevar a la perdida parcial o total del capital, no se hace ninguna recomendacion de compra o venta de dichos activos las desiciones que tome es bajo su criterio.

domingo, 4 de septiembre de 2016

Factom

En el gráfico de 1 hora podemos ver la clara tendencia bajista que presenta el precio en FCT/BTC a su vez trazamos una linea de tendencia del cual el precio se sitúa en estos momentos como indecisión existe la probabilidad que continué bajando pero en estos momento se encuentra haciendo una cierta corrección en su movimiento la cual tenemos como resistencia clave a romper para que cambie de tendencia 0.618 de los niveles de Fibonacci pero también existe la probabilidad en rebotar y continuar su tendencia al tocar el nivel 0.5 de Fibonacci.
 Ahora si analizamos con los indicadores tecnicos el ADX en conjunto con el RSI el precio puede realizar una corrección y oscilar entre los precios de 0.00482000 y 0.00441447 para después continuar bajando.

Seguimos analizando Monero (XMR)

Que tal en el siguiente gráfico de 1hr XMR/BTC podemos ver con anterioridad los movimientos que realizo el precio (1) de XMR el cual cumplió con la divergencia que se dio en el precio y en el RSI (2) donde este ultimo no coincidió junto con el movimiento del precio al no llegar en zonas de sobre compra, del cual el precio de XMR realizo una corrección donde esto lo consideramos como un descanso y así poder continuar su recorrido alcista.
Ahora analizamos los probables próximos movimientos que realice el Precio de Monero las siguientes horas, si consideramos los indicadores técnicos como el ADX (1 este nos indica la fuerza de la tendencia) vemos el cruce de estas tres lineas el cual la verde nos indica alcista y la roja bajista vemos como la linea verde esta por encima de la linea roja del cual quiere decir que continuara subiendo, pero ojo su fuerza es muy débil si consideramos la linea negra que se encuentra aproximadamente en el nivel 20.83 ya que en estos niveles su tendencia alcista es débil y en conjunto con el RSI (2) podemos observar que se encuentra en zonas de sobre compra, del cual el precio pueda encontrarse en lateral (subidas y bajadas poco considerables) oscilando entre los valores de 0.0236 y  0.0200 y posteriormente aumentar su valor.

Nota: no es una recomendación de compra o venta, operar con criptodivisas puede llevar a la perdida total o parcial de su capital, es recomendable llevar a cabo una buena gestión de riesgo antes de realizar cualquier tipo de decisión.

miércoles, 31 de agosto de 2016

Cambio de panorama

Desafortunadamente hemos decidido en dejar por un rato la faucet y realizar unos pequeños cambios en cuanto a la faucet, buscando planear otra modalidad para compartir satoshis con los usuarios y seguir realizando análisis técnicos de las criptodivisas.

Hace unos días habrán notado el aumento significativo del valor de la criptodivisa Monero (XMR) del cual la semana pasada tuvo una gran capitalización haciendo que aumentara casi un 90% de su valor, esto debido por la aceptación y uso en la deep web el cual supuestamente el crimen a empezado a usar para realizar transacciones puesto que cuenta con unos de los principios fundamentales que debe tener una criptodivisa el cual es el anonimato.

Ahora bien, dentro del siguiente gráfico con temporalidad diaria, podemos apreciar los importantes aumentos en su valor los últimos días, del cual tenemos una muy clara tendencia alcista pero hasta el dia de hoy vemos como el precio retrocede de sus máximos anteriores que ha realizado podemos decir que en base al indicador RSI (linea azul) se encuentra en el área de sobre compra del cual podrá realizar movimientos hacia abajo que sera el mismo movimiento que haga el precio de XMR. Debemos de tener a consideración que el día 1 o 2 del mes de Septiembre existe la posibilidad de un aumento significativo en su precio, pero por el momento supongamos que no sucede nada en cuanto a esos días, donde el panorama para  XMR puede ser muy diferente el cual en base al indicador ichimoku el precio puede romper con facilidad la parte menos ancha de la nube y tener un importante cambio de tendencia.
Ahora, viendo el gráfico en una temporalidad mucho menor, específicamente en 5 minutos podemos ver como el precio se encuentra situado dentro de la nuve y a su vez tocando un nivel de fibonacci (0.5) en caso de romper ese nivel junto con el tenkan-sen (linea azul) existe la probabilidad que tenga un alza a los siguientes niveles haciendo sus respectivas correcciones, pero también esta la posibilidad que el precio se detenga justo en donde se encuentra y continuar hacia abajo haciendo un minimo mayor pero seria oportuno ver si dentro del RSI se formara una divergencia para encontrar una posibilidad de compra.

jueves, 14 de julio de 2016

USDCAD

what up cryptoraiser as discussed in a rescpecto article that would conduct technical studies forex in the following chart we in 15 minutes the pair USD / CAD which we see a possible change of trend where the price is above the cloud but not separate one would have to wait for the Tenkan-sen also break the cloud and a candle close above the Tenkan-sen also if given this scenario we could confirm a strong upward trend since the chikouspan (green line) can break easily cloud this will argue for reduced cloud formation, would only be to wait confirmation within a few minutes more.
http://cryptotraders.blogspot.mx/

martes, 12 de julio de 2016

USDCHF

Hello cryptoraisers how you going? here we have on daily chart below we have the USD / CHF which if we look at the technical indicators we see a clear buy signal where the Tenkan-sen and kinjun-sen where closures bullish candles on the same is crossed and on the cloud where furthermore we have the confirmation of Chikou span that is the green line which we aim to achieve the price of 0.99570 that can be said is the key resistance break otherwise we will have a decrease of the level of fibonacci to 0.786 remember that also the USD / CHF is correlated with gold so if the gold price drops entoces USD / CHF rises.

Another thing to mention is that still has not been a great significant movement in the price of Bitcoin far.
http://cryptotraders.blogspot.mx/

sábado, 9 de julio de 2016

Happy halving day!

As you know today is the day of halving which consists in reducing bitcoin reward but so far we have not seen that affected the price considerably cryptoraiser but the team speculated that the price may fall.

We are also happy to announce that there are about approximately 1000 Users who have received their payment from the faucet.

Another thing is that we enable announce which ads to place your referral links, websites, blogs, etc. Of which are the white boxes where you can advertise. Next week we will publish studies about FOREX.
http://cryptoraiser.com/

lunes, 4 de julio de 2016

Silver!

Hello cryptoraisers how you can see we have reduced the rewards of satoshis since we are a few days of halving for the Bitcoin which we believe can positively affect the price, also consider the litecoin which also have features halving but this will happen to the first day of August.
So here we have the chart of silver daily which we can see the RSI indicator shows a huge overbought, this is because investors consider it as a good haven for their capital and other things that might affect positively like Brexit also if we look at the fibonacci retracement price touched the $ 21.00 USD where until that point there was a setback and which may be a correction and then continue until that point and expect a candle closing above that level and analyze patterns of candles.

You can get directly from this asset as silver and gold in Bitgold (GoldMoney) as you can see in the banner and apply for these precious metals to the door of your home.

Remember conduct their studies before operating these assets and take risks on their own decision.
http://cryptotraders.blogspot.mx/

jueves, 30 de junio de 2016

Like silver

Hello cryptoraisers the litecoin consider him dead by many miners or investors but time has gained some value where previously the price of litecoin had a value of $ 3.20 USD but nowadays is around about $ 4.10 USD so in the daily chart we see the price of litecoin has reached to touch the last Fibonacci level where a previous bearish candles touch and return can expect a trend change to the upside where the delayed price reaches break where indicated by the blue line is likely to be triggered even more otherwise if the price of candles touch the cloud and back we can continue oscillating at the price of $ 4.20 USD but surprise approaches the halving anything can happen what the Bitcoin altcoins will do the rest.
cryptotraders.blogsptot.mx
Before entering make decisions on buying or selling it is advisable to perform your own analysis.

martes, 28 de junio de 2016

gold... in digital

Here we have the stocks of Goldmoney Inc also know as Bitgold is the same company but now let's focus on the technical analysis of the shares of the company, as you can see on the chart the broked price support cloud that has been the red line which we expected to touch that line and then bounce but as we see the body bearish candle is great just would have to wait candle close below the cloud and make a correction and then try to break the cloud and have an uptrend.
In that company can buy and sell gold at a time you can use the bitcoins to buy gold.
http://cryptotraders.blogspot.mx/

sábado, 25 de junio de 2016

Because not everything is money

We have the shares of Tesla Motors in shart shown below (1D) can say that had a change of very strong trend which confirms the breakdown of price and delayed price (green line) with the cloud also by the crossing the "moving averages" as they are often buying and selling signals, the fall is due to Brexit that occurred on Thursday that affected several world markets.
In the daily chart we can see the change that has and also a GAP (gap in price) down can make a few corrections and go down before recovering and would be beneficial to make a change.
Remember to do your own analysis and come to your own conclusions and make the decision to go to operate the shares.
http://cryptotraders.blogspot.mx/

viernes, 24 de junio de 2016

Like we said

What up cryptoraisers a month ago we talked about the price of DASHCOIN where we mentioned that the price was likely to fall ... and it was so you can find the entrance where we talk about the dashcoin on the following link http://cryptotraders.blogspot.mx/2016/05/hello-cryptoraisers-in-following-chart.html

So now on the next daily chart  we return to analyze the price of DASHCOIN and we can see the clear downtrend since this justify it when the price is below the cloud, so it is likely that the price into range or side and wait for a break in the following levels of Fibonnacci to reach resistance Kumo (cloud) and this analyze more in detail the price.

Remember if you want to continue this analysis to buy or sell the above asset recommend them to perform their own study and consider the risks that entails.
http://cryptotraders.blogspot.mx/

jueves, 23 de junio de 2016

Why the bitcoin price has dropped?

Surely wonder about the drastic fall that had the bitcoin, but first let's talk about why their rise that had some previous days, their rise was due to the devaluation that took the Chinese Yuan (CNY) where this significant influence on the price of bitcoin since also in china are important centers of mining, however let's focus on the recent slump that had the bitcoin from $ 778 dollars to $ 630 approximately, some analysis can influence the exchange house Bitfinex as it is one of platforms where mostly traded the bitcoin but a few days ago was in maintenance and caused panic among traders platform where they could not cancel their orders, another factor that could influence the price drop was the auction that took and in Australia out of 24,500 bitcoins which these were seized crime. Cryptoraiser team speculates that the price of bitcoin can reach the $ 800USD since these scenarios have already seen before. if you like to learn how to trade prices or other currencies criptomonedas and leave a comment and happy for the next entry share information about how to do technical analysis.
http://cryptotraders.blogspot.mx

martes, 21 de junio de 2016

Where do you practice trading?

There are many brokersd onde do TradingCo n conventional currencies, but lately there breoker with which you can do tradin with bitcoins of which can trade stocks, forex, indices and commodities, usually prefer to operate with brokers in bitcoins, lately there is one very good it is called the whaleclub but their assets are very limited but w ay igualm is a good place to do trading.
https://whaleclub.co/join/t1Jve

Nice

Apparently the price of ethereum it will recover slowly since it is gaining territoria but currently the price is oscillating in one of the important levels Fibonacci retracement which is touching resistance at that level in the chart 1H of which ara a slight decline since we rely also on the RSI indicator which tells us that is in the overbought area this means you can make a pullback in price and continue up shortly after. But remember it will be to take a decision on whether there will be a Hard Fork this can also affect one way or another in the price.
http://cryptotraders.blogspot.mx

lunes, 20 de junio de 2016

Get bitcoins for free each 15 minutes

to remember only can acquire free bitcoins every 15 minutes and can get a 50% commission for referring a friend only need to reach the minimum to ask your purse are about 15000 satoshis. We hope you have a nice day.
cryptoraiser.com

Black gold... sure

What up cryptoraisers? in the following chart we have the oil (WTI) where the daily chart we can see the bearish candles actually touch a Fibonacci level that functions as a support and made a bounce up which we confirm the change of trend by closing two bullish candles which can reach the level of fibonacci in the price of $ 51.20 US dollars and make a next throwback to the previous level where the bearish candles were, then if you make that move the oil the USD / MXN will make a similar move by example if oil rises then the USD / MXN down.
So remember this is not a recomendation to buy or sell is just a superficialy  technical study all your dessisions are by your own risk.
http://cryptotraders.blogspot.mx/

sábado, 18 de junio de 2016

Not now please

As you know about the theft of millions of ethers affection seriously in the price of ethereum, as we see in the daily chart the price is playing near 10.14 USD in the Level Fibonacci where both the broked price cloud hichimoku the which if it breaks that level and closed with a bearish candlestick is very likely to collapse further price ethereum, still to be confirmed the rupture of the cloud with the current delayed price (green line) and if so, the price could get to the next level of Fibonacci up to 7.06 USD, I hope to be wrong.
Remember, it is not a recommendation for buying and selling decisions made at your own risk.
http://cryptotraders.blogspot.mx/

Bitgold

As you read the ad, you can make payments and savings in gold! to acquire gold you can buy by credit or debit card, including bitcoins this option is that more opto because it is very easy to acquire bitcoins.
Once you have made your purchase gold can request the prepaid card which you can remove gold and cambiartelo by other currency already Euro, US Dollar or British Pound or if you like another better way, apply the physical gold to the door of your home! I personally opt for the prepaid card as it provides many facilities as you can make purchases on the Internet or anywhere in the world no matter where you live.

http://tracking.bitgold.com/aff_c?offer_id=23&aff_id=56719&tiny_url=0


If you know something about bitcoins you can get each 15 minutes, and there a technical study about currencies like BTC/USD, ETH/BTC, XAU/USD (gold) and more.
cryptoraiser.com

viernes, 10 de junio de 2016

So..

Hello how are you? as you can see in the chart NEXT price LTC / BTC we can see how the price touches the support of the cloud which makes rebound is where we expect the price is directed upward but do not know exactly when it does we can be optimistic as the price of Ichimoku indicator delayed because this far from the cloud which is also more than clear an uptrend. So the litecoin is not dead at all.
Remember is not a recommendation to buy or sell only do a technical study superficially
http://cryptotraders.blogspot.mx/

jueves, 9 de junio de 2016

Well well

Here we can see in the daily chart the price of ETH / USD which is playing a resistance which we can assume that could go down and then take strength then up aiming the $ 15 USD approximately and there is a Probability that the price to skyrocket, but remember this is only a superficial study, have a nice day.
http://cryptotraders.blogspot.mx/

lunes, 6 de junio de 2016

Halving

One issue that few know and many speculate .... so give my point of view this time and my decision based on my experience!
That is the Halving?
A halving in Bitcoin refers to the halving of the reward received miners to complete a transaction block. As we explained at times, mining is crucial to the security of the Bitcoin network, while it is a very complicated task, therefore, the Bitcoin protocol includes a mechanism to encourage people to undermine: every time solve a block miner does, receives a financial reward.
http://cryptotraders.blogspot.mx/

lunes, 30 de mayo de 2016

DAO

What up cryptoraiser perhaps have noticed that the Sunday page was out of this because of the updates that are making on the page which does not affect what you have raised, changing the subject, today we focus on DAO (Decentralized Autonomus Organization) not only it is a new currency but also it is a network that promotes structures of collective organization on the internet and especially autonomy, basically functions as a trade between users, but preferably would expect to spend time to see how it works.

http://cryptotraders.blogspot.mx/

sábado, 28 de mayo de 2016

Litecoin

What up Cryptoraisers how are you? as you know the bitcoin I reach the value of $ 500 USD this is beacuse to the devaluation of the Chinese Yuan which this affected the price of BTC positively in the same way the litecoin due to the high demand for this cryptocurrency, remember that we also a few days of halving not known exactly might happen, this day we focus on the LTC / BTC which in recent days has had a remarkable rise in spending of about $ 3.20 USD to $ 4.50 about, as we can see on the daily chart the RSI indicacor points touched overbought which indicates that you will have a slight fall and then gain momentum and then make new highs.
So remember this is not a recommendation to buy or sell the decisions you make is at your own risk.
http://cryptotraders.blogspot.mx/

jueves, 26 de mayo de 2016

Lisk

Hello again cryptoraisers, a few days ago recently came a new cryptocurrency which within hours of its launch exceeded the Dashcoin and the cryptocurrency to which I refer is the Lisk long before launch speculation about their price as they come to have a value of 8 USD before launch, but recently it came out the price started to go down and have a value of 0.22 cents but within hours has been starting to climb up the value of 0.55 cents, I do not have much information regarding this cryptocurrency but seems attractive because it is rumored may occupy the third major cryptocurrencies. Remember this is not a recommendation to buy or sell.
http://cryptotraders.blogspot.mx/?m=1

miércoles, 25 de mayo de 2016

Ethereum

Hey how are the present day? as you know recently we analyze the price on the DASH / BTC and indeed, the price went down in a few days will give continuation to the study of the pair, now see another pair he has recently emerged and has had great acceptance the ethereum in the daily chart we see the RSI indicator which is a divergence which has led to ethereum downward, which can go down and run into the support of the cloud and probably bounce up in another situation we may find that the price staying within the cloud and a wide variation range in price.
Remember it is only a superficial technical study are not giving recommendations for buying and selling is at your own risk.
http://cryptotraders.blogspot.mx/


martes, 24 de mayo de 2016

Dashcoin

Hello cryptoraisers, in the following chart we see the price of par DASH / BTC as seen in the time frame we see daily as the price been giving in the last days unlike last week where he had a slight increase but this is not hard much as it as seen in the graph using the indicator hichimoku the price may go down only if the price goes cloud support the span B being even a little likely to collapse.


Remember, this is not a recommendation for buying and selling the pair is only superficially technical analysis

lunes, 23 de mayo de 2016

Cryptoraiser

Hello cryptoraisers we are a new company in wich we focus on providing information regarding the price of the cryptocurrency and why not, also of the common currency, wich analyze a technical study regarding the Dashcoin, Bitcoin, Ethereum. As time passes we will improve the faucet and provide better service to users.
But remember the study we conducted is not a recommendation, so make decisions at their discretion and under its responsability.